
Statistical Analysis - 1
Independent Sample t-Test and A/B Test
Theory
Assumptions:
- X and Y are independent
- X and Y have same variance $\sigma^2$
- X and Y from normal distribution, respectively
(*)Test Statistic Under Un-equal Variance
Test Statistic Under Equal Variance
- Under Normal Distribution (Independent Sample T-test):
- Under Binomial Distribution (A/B Test):
- Option 1: Assume same proportion
- Option 2: Assume different proportion
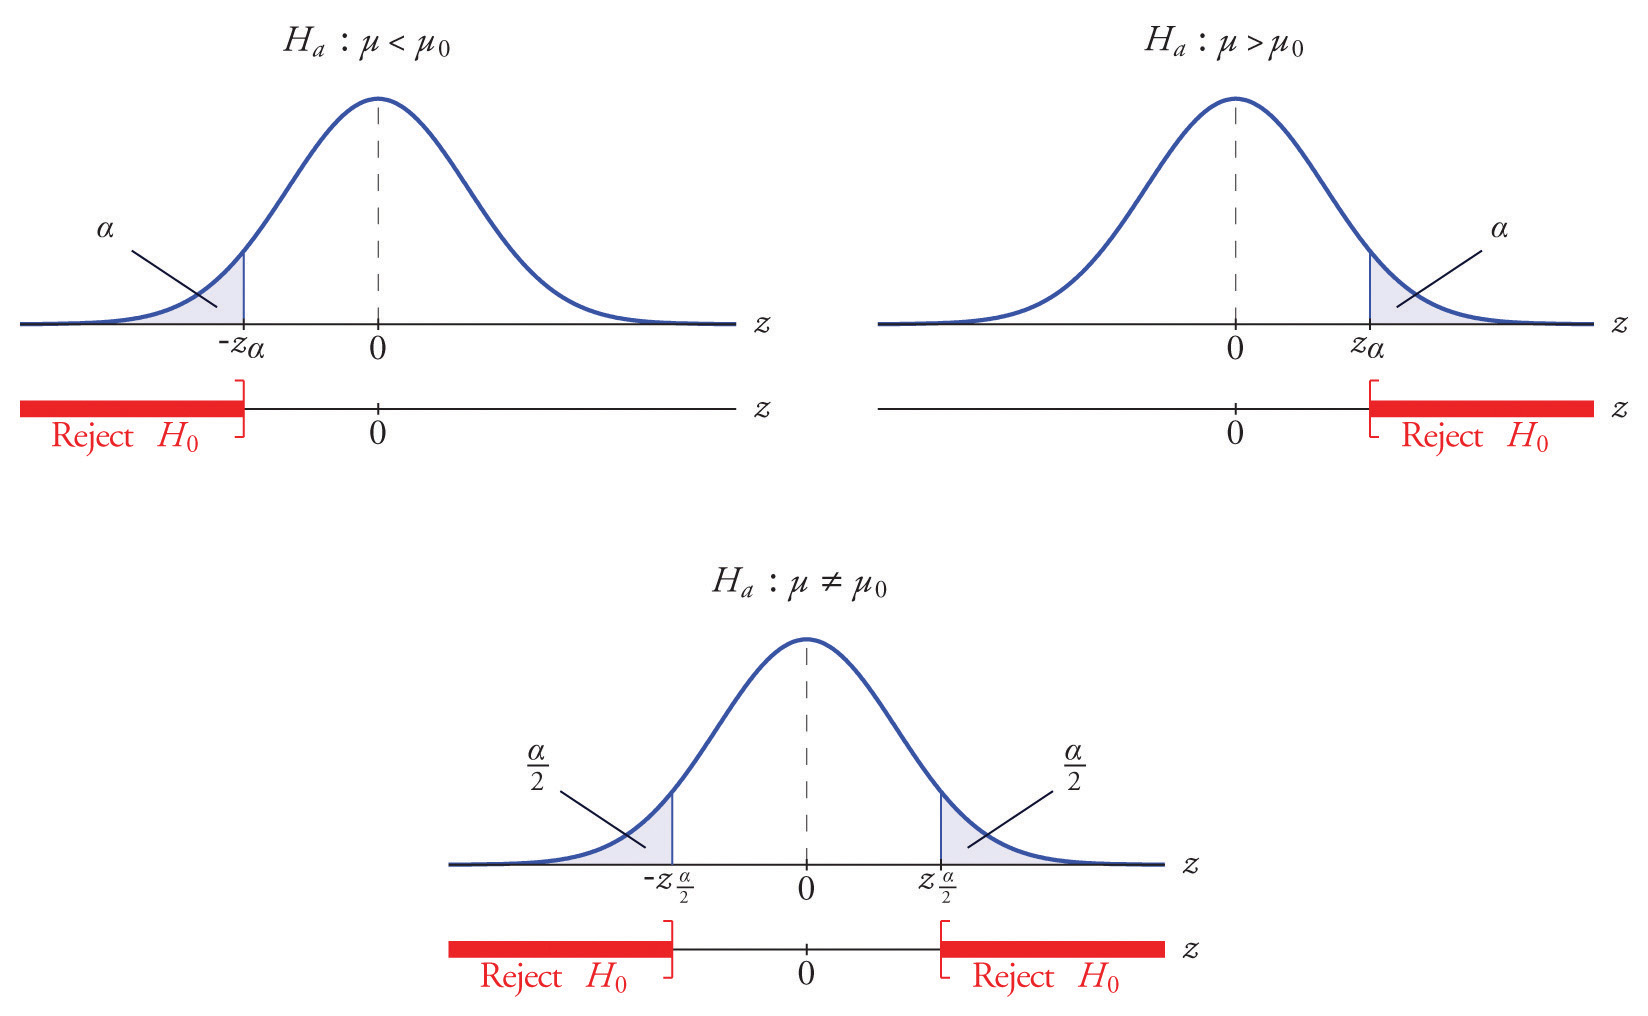
One-Tail vs. Two-Tail Test
- Two Tail: Compare $ \vert T \vert $ with $t _{m+n-2} (\alpha/2) $
- One-Tail: Compare $T$ with $t _{m+n-2}(\alpha)$
Violation of assumptions
-
For $1^{st}$ assumption (Independence) : by experiment design
- For $2^{nd}$ assumption: Perform *Levene test *
- Null hypothesis: samples have same variances
- Reject null hypothesis when $p<\alpha=0.05$
- When violated, the calculation of $df$ will change
- Alternative: perform log transformation to stablize variation
- For 3rd assumption: Perform Shapiro-Wilks test
- Reject null hypothesis when $p<\alpha=0.05$
- When sample size is big, still valid (asymptotic normality)
- Reason: Central Limit Theory for $\bar X$ and $\bar Y$
Relationship with Likelihood-Ratio Test
- Can be proved to be equivalent
Non-parametric methods
-
Mann-Whitney Test: https://en.wikipedia.org/wiki/Mann%E2%80%93Whitney_U_test
-
Wilcoxon Rank Sum Test

- Advantages
- Small sample size
- Robust to outliers
- No need for normal assumptions
- Disadvantages:
- Higher Type II error
- Lower power
- Not really needed for large sample
Calculate sample size / Power
Power:
- $P$(reject $H_0 \vert H_1$ is true)
- Commonly 80-95%
- Red shaded area
What impacts power
- Effect Size (+)
- Sample Size (+)
- Significant Level (e.g., 5%) (+)
- Population SD (-)
- Conversion Rate vs. Actual number of visits
-
ref: https://onlinecourses.science.psu.edu/stat414/node/304/
- Combined equation
-
Effect Size
-
Significance Level
-
Calculate sample size
p_baseline = 0.50 # under H_0
effect_size = 0.05 # Desired effect size
sig = 0.99
sample_size = 1001
#https://onlinecourses.science.psu.edu/stat414/node/306/
-
Look up table: $Z(\alpha) = 2.326$
- Calculate power of test
- Standardize user-provided $ES$
- Calculate the arrow point on blue axis:
- Calculate the area of blue
- Calculate the area of power
- How to calculate Sample Size:
- Formula for sample size estimation under $95\%$ significance and $80\%$ power.
s_x = np.sqrt(p_baseline * (1 - p_baseline))
s_x
0.5
s_p =  s_x * np.sqrt( 1 / sample_size)
s_p
0.01580348853102535
effect_size_N_0_1 = effect_size / s_p
effect_size_N_0_1
3.163858403911275
phi_value = 2.326 - effect_size_N_0_1
phi_value
-0.8378584039112749
blue_shade = norm.cdf(phi_value)
blue_shade
0.2010551163605569
power = 1 - blue_shade
power
0.798944883639443
#Just use formula
N_size = 16 * p_baseline * (1 - p_baseline) / (effect_size * effect_size)
N_size
1599.9999999999998
Online Experiment
A/A Test
- Assign user to one of the two groups, but expose them to exactly same experience
- Calculate variability for power calculation
- Test the experimentation system (reject $H_0$ about 5% given significant level as 5%, with dummy treatments)
-
Shut down treatment if significantly underperform
- Maybe something is wrong with how system assign treatment to users
Type of variates
- Call to action
- Visual elements
- Buttons
- Text
- Ad: Promotion vs. Benefit vs. Information
- Tweets: length/style/emoji/etc
- Image and Video
- Hashtags
- Backend (e.g., recommendation algorithm)
Select evaluation metric
- Short-term vs. Long-term
- adding more ads –> short-term revenue
- loss of page views/clicks –> long-term revenue loss / user abandonment
- Consistent with long-term company goal, and sensitive enough to be detected
- KPI: hard to detect change in a short time
- Evaluation metric: strong correlation with KPI as a proxy
- Example of metrics:
- Netflix Subscription: Viewing hours
- Coursera Course certification: Test completion / Course Engagement
-
By selecting better evaluation metric
- Search Engine: Sessions per user instead of queries per user
- $\frac{Queries}{Month}=\frac{Queries}{Session}\times\frac{Session}{User}\times\frac{User}{Month}$
-
By quantifying loss of traffic:
- Putting Ad on Homepage: (decrease in click-through rate) X (visit frequency) X (cost of regenerating this traffic from other sources)
Limitations
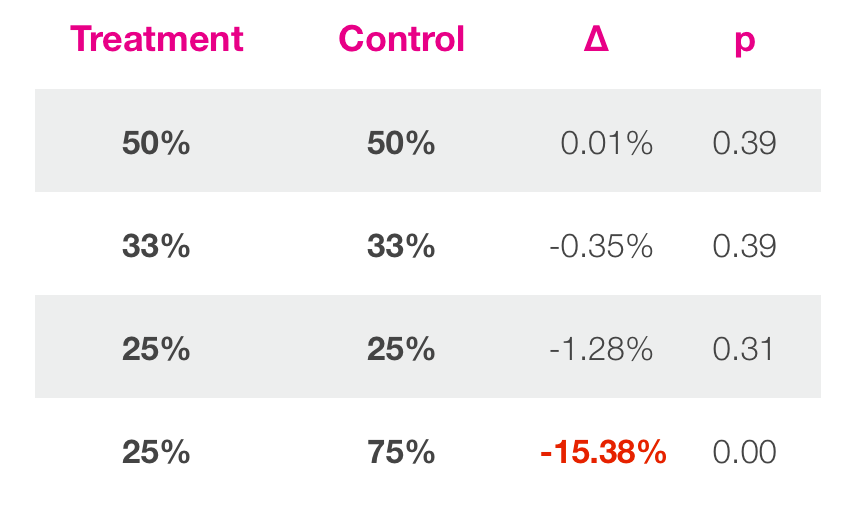
- Analyze across key segments
- Browser type
- Device type
- New and return users
- Men and women
- Geo
- Age
- Subscribers
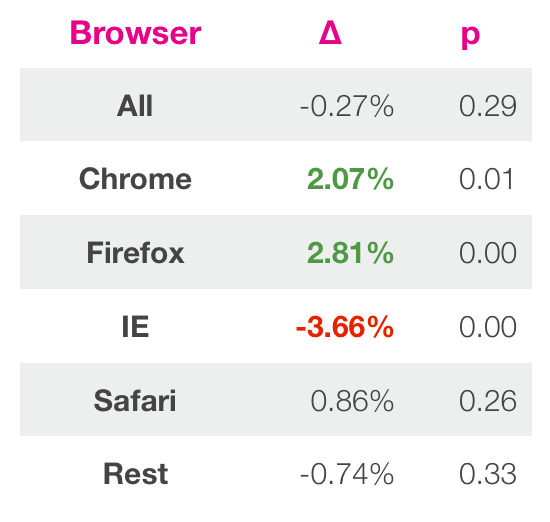
Alert: Multiple comparison issue.
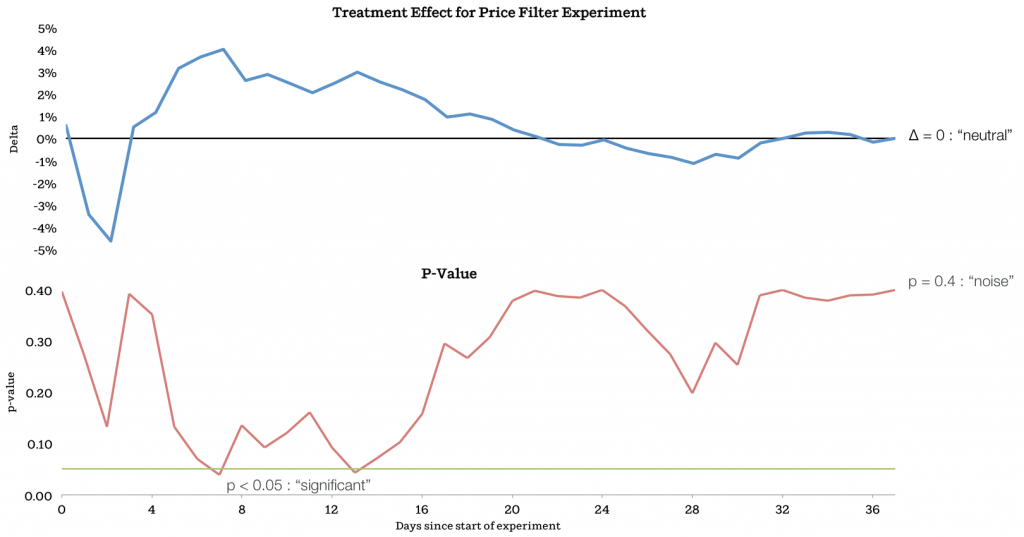
- Temporal factors (non-stationary time-series)
- e.g, day of week effect
- other periodical events
- Treatment ramp-up
- Start from 0.1% treatment, gradually to 50%
- A 50%/50% design is much faster than a 99%/1% design (25 times faster)
-
Early stopping
- Preference to old or preference to newness
- Novelty effect
- Longer time
- Only expose to new users
- Novelty effect
- Implementation cost
- Performance speed
- Slow feature: bad experience
AB test vs. Bandit


Network effect
- Sample consistency: for example, GCP, two uses in one collaboration group faces two different features. Or adding a video chatting feature, which only works if both sides have access to it
-
Sample independency (Spillover effect), for example, Facebook: many connected components, thus Group A and B are no longer independent.
- Possible solution: community (cluster) based AB test by partitioning nodes to groups, or for a dating app with no prior connections, maybe using demographic/geographical attributes
- Each cluster is assigned a treatment, thus unlikely for spillover from control to treatment
- Unit of analysis is reduced, higher variance as a result
Ref: http://web.media.mit.edu/~msaveski/projects/2016_network-ab-testing.html

Case Study
Problem Statement
- Given a feature difference in facebook app, evaluate if the change will improve user activity.
- Given a UI component change (e.g., button color) in a pageview, evaluate if there are more users clicking.
- Given a pop-up message, whether users will continue enroll in program or not
- Given a new firewall feature in GCP
http://rajivgrover1984.blogspot.com/2015/11/ab-testing-overview.html
For example: An online education company tested a change where if the student clicked “start free trial”, they were asked how much time they had available to devote to the course. If the student indicated 5 or more hours per week, they would be taken through the checkout process as usual. If they indicated fewer than 5 hours per week, a message would appear indicating that these courses usually require a greater time commitment for successful completion, and suggesting that the student might like to access the course materials for free.
Choose Subject (Unit of diversion)
Possible Choice:
- User id
- Cookie
- Event
Choose metric
Example of pop-up message and program enrollment
Guardrail Metrics that should NOT change:
- Number of cookies, unique # of cookies visiting the page
- Number of clicks on the button (since message shown after clicking)
Metrics that MAY change:
-
User Aquisition: $p = \frac{Number\ of\ users\ actually\ enrolled}{Number\ of\ users\ clicking\ button}$
-
User Retention: $p = \frac{Number\ of\ users\ remain\ enrolled\ for\ 14\ days}{Number\ of\ users\ clicking\ button}$
User Growth

